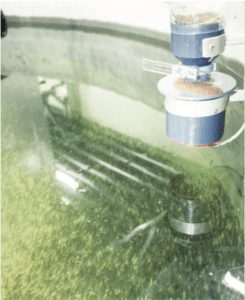
RAS farms generate enormous amounts of fine particles. These particles can have multiple origins, such as feed, feces, biofilm release or from various other sources in the system. High concentrations of particles have been proven to have direct adverse effects on fish stress levels, growth, disease resistance, and gills. The effects are, however, not limited to the fish but are also detrimental to both biofilter and degasser performance.
High levels of fine particles increase heterotrophic bacterial growth, which in turn can reduce TAN removal in the biofilter, raise oxygen consumption and increase CO2 production. Trapping and sudden release of fine particles can have very serious negative impacts on water quality, which often is associated with large fish mortality.
Therefore, it is important to measure particles in the water and monitor the levels of particles throughout the production phase. There are different ways to monitor particles in the water, each with its strengths, and often hard to directly compare against each other. Turbidity is the optical property of water where both dissolved and suspended materials can influence the scattering of light in the sample.
Turbidity has historically been used in field studies due to the relative ease of measurement as well as the relative relationship with total suspended solids.
 How?
How?
Turbidity can be measured with a centralized sensor cabinet with many sensors, such as specialized turbidity measurement under pressure, that monitors the on-site water quality from up to 12 places. This means the water samples are sent to the sensor by decentralized pumps, delivering from strategic locations across the RAS farm in the same manner as a worker would sample those places manually.
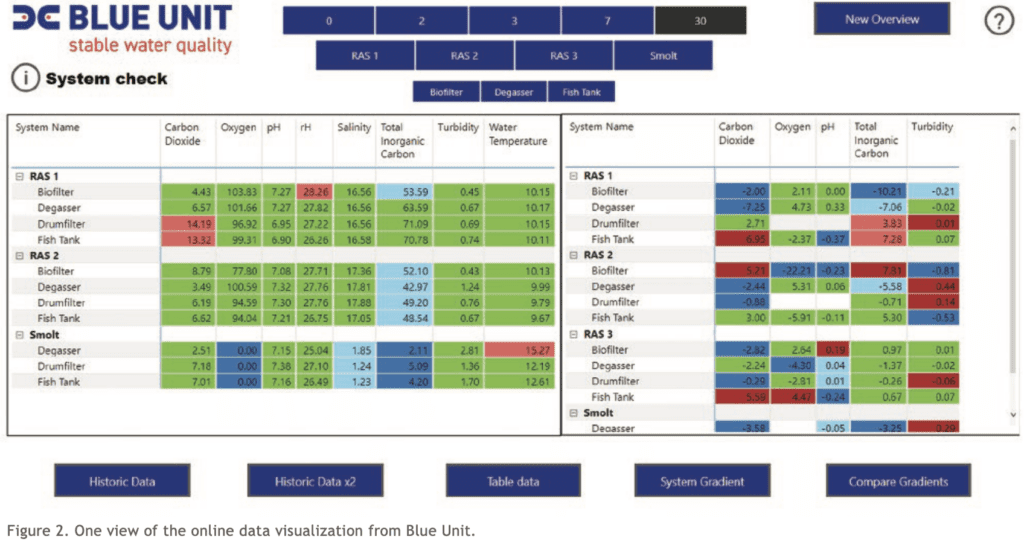
Using a single sensor means all measures can be directly compared against each other without sensor error interference. This makes it possible to calculate changes across various devices in a RAS, which can be called gradients. By applying gradients, advanced alarms can be provided for an early warning against a poorly functioning water treatment device on a RAS farm.
Due to the replicability of the solution, benchmarks for gradients and water quality changes can be calculated and presented for all clients around the world. This is done via an intricate anonymization of the data, so no information is shared between the individual clients but still indicates individual performance via an online visualization platform. One of the more important benchmarks to follow is the turbidity gradient across all devices, such as fish tanks on the farm.
Turbidity gradients on a malfunctioning fish tank
If a fish tank is not efficiently removing particles, then data indicates that the other devices of water treatment do not function correctly. A malfunctioning fish tank will cause poor drum filter performance followed by heavy particle trapping either inside the biofilter or degasser. Particle build-up can result in tragic results, including the establishment of pathogens, hydrogen sulfide release or, as in the following example, a loss of fish appetite and bacterial infections.
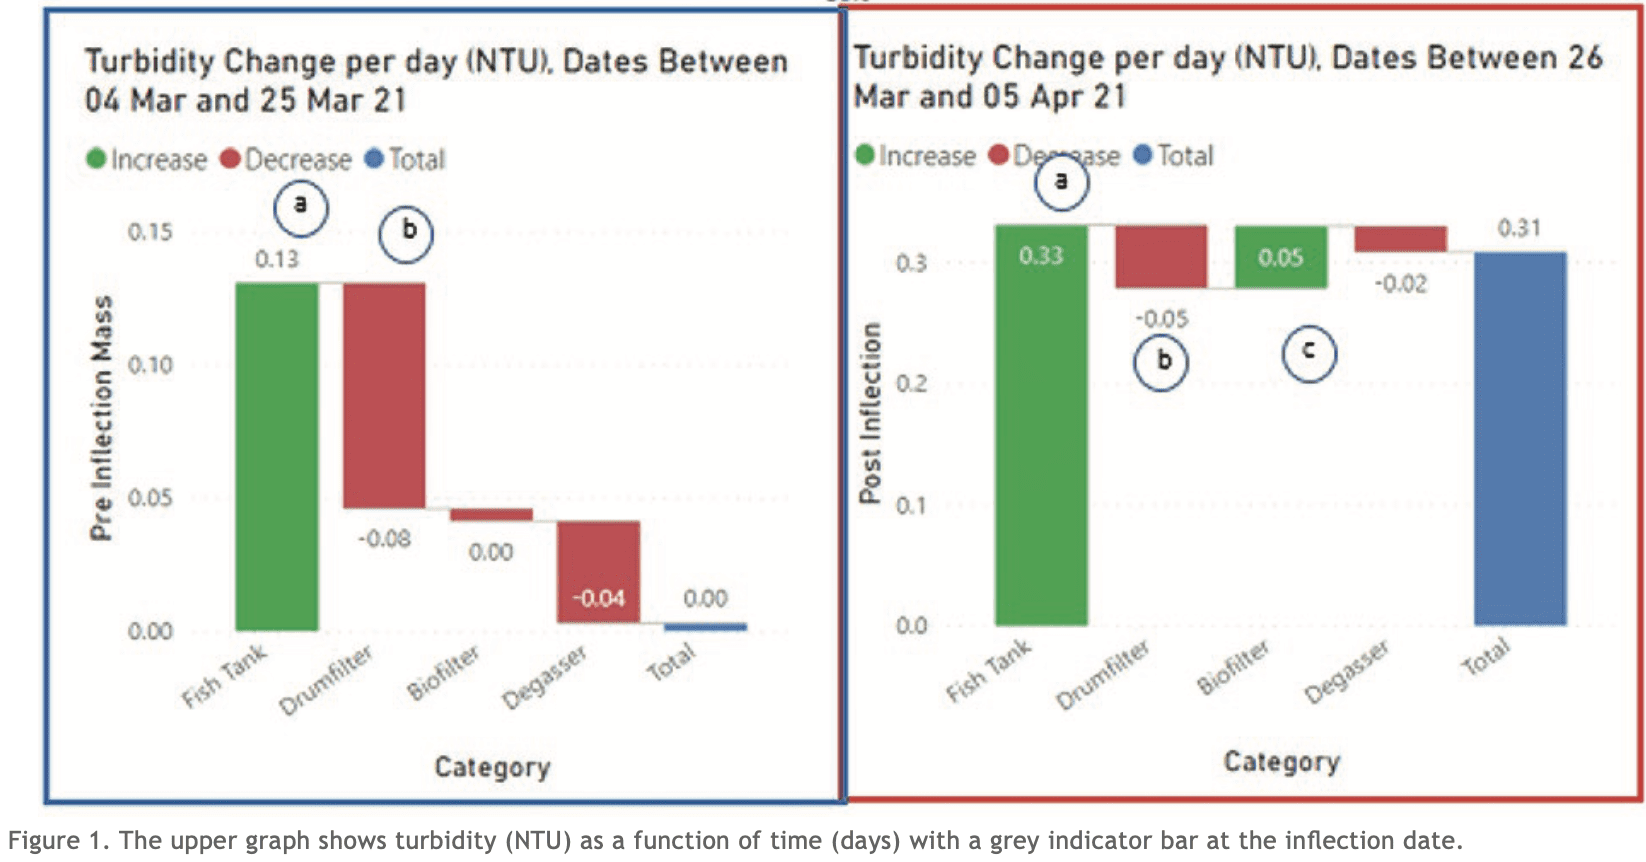
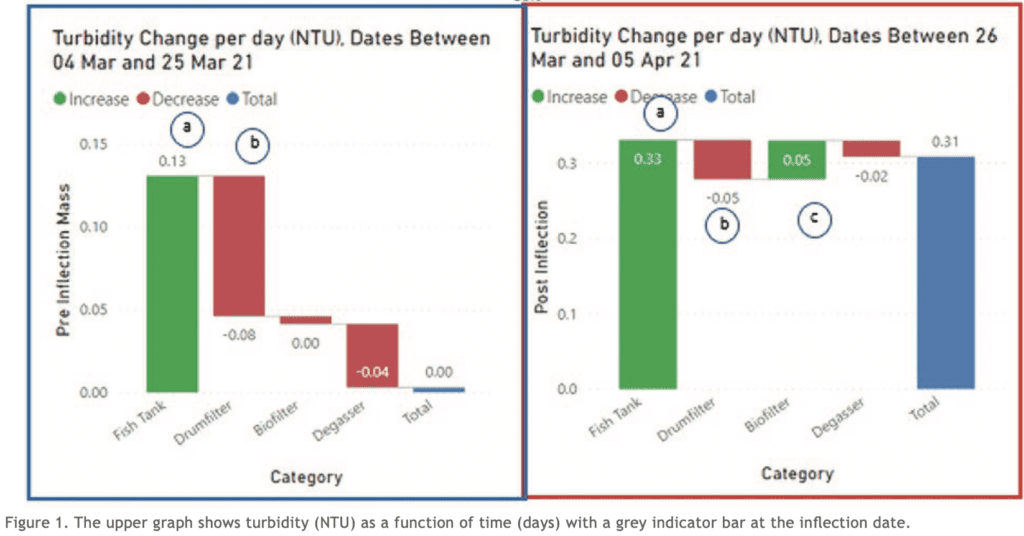
But how did poorer self-cleaning by the fish tanks impact the rest of the RAS farm? A mass balance that determines how much turbidity was shifted by each device per day clearly indicates the effect.
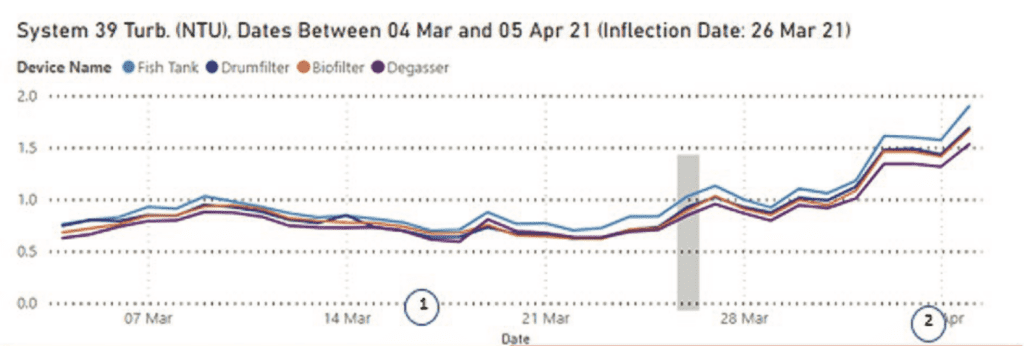
The top graph in Figure 1 shows the turbidity time series for the RAS farm. In Period 1, a stable turbidity level persisted, until the grey bar (fish tank performance alert). Thereafter, turbidity rapidly increased – Period 2. The mass balance for Period 2 saw 0.33 NTU turbidity passing across the fish tank per day (Fig. 1 a, red box). This is more than twice the 0.13 NTUs of turbidity passing across the fish tank in a day in the period before the alert (Fig. 1 a, blue box). Drum filter performance also reduced from removing -0.08 NTUs in Period 1 to removing -0.05 NTUs in Period 2 (Fig. 1, b). The biofilter also began to lose particles following the change in fish tank performance (Fig. 1, c).
From the overall pattern, the change in fish tank performance meant particles stayed longer within the fish tank, creating additional fine colloids that pass more readily through the water treatment devices, contributing to a general increase in system turbidity.
Summary
Monitoring gradients around RAS farms is one of the most useful tools to manage the overall fish farm water quality. A malfunctioning device, such as a fish tank, will create issues for other parts of the RAS farm. Data indicates that turbidity issues will also be often associated with detrimental values for many other water quality parameters and finding the root cause for bad water quality or poor fish health can be hard to locate without heavy use of labor hours or a centralized solution that gathers enough data to confidently locate the issue.
By measuring in a centralized fashion, a fish farm manager can identify where turbidity is being created and removed. A fully automated system that continuously monitors and uses data for modeling allows fish farmers to react more efficiently as compared to older management approaches. Without the data then the farmers are destined to act based on limited intel without having the data to back up their decisions that could enable them to act with precision.
An internal analysis showed that after the installation of centralized monitoring equipment with online 24/7 visualization, all monitored fish tanks saw a reduction in turbidity. This in turn was accompanied by a reduction in CO2 level in 33 out of 36 fish tanks. Thus, underlining that many seemingly well-performing fish farms still have room for serious improvements in the functioning of their water treatment systems. Moving towards using gradients and a holistic farm health view, a higher yield can be accomplished, while still maintaining a high degree of fish health.
Click to see our solution : TurbiFlex