Elevated levels of hydrogen sulphide (H2S) are often associated with lethal effects on fish. This adverse effect is present at different concentrations since multiple parameters, such as temperature, oxygen saturation and salinity as well as redox potential, influence the toxicity of H2S in water. The presence of oxygen will work as a protector against the presence of H2S by oxidation, but it is too slow a process to protect fish on occasions of sudden H2S release to the environment.
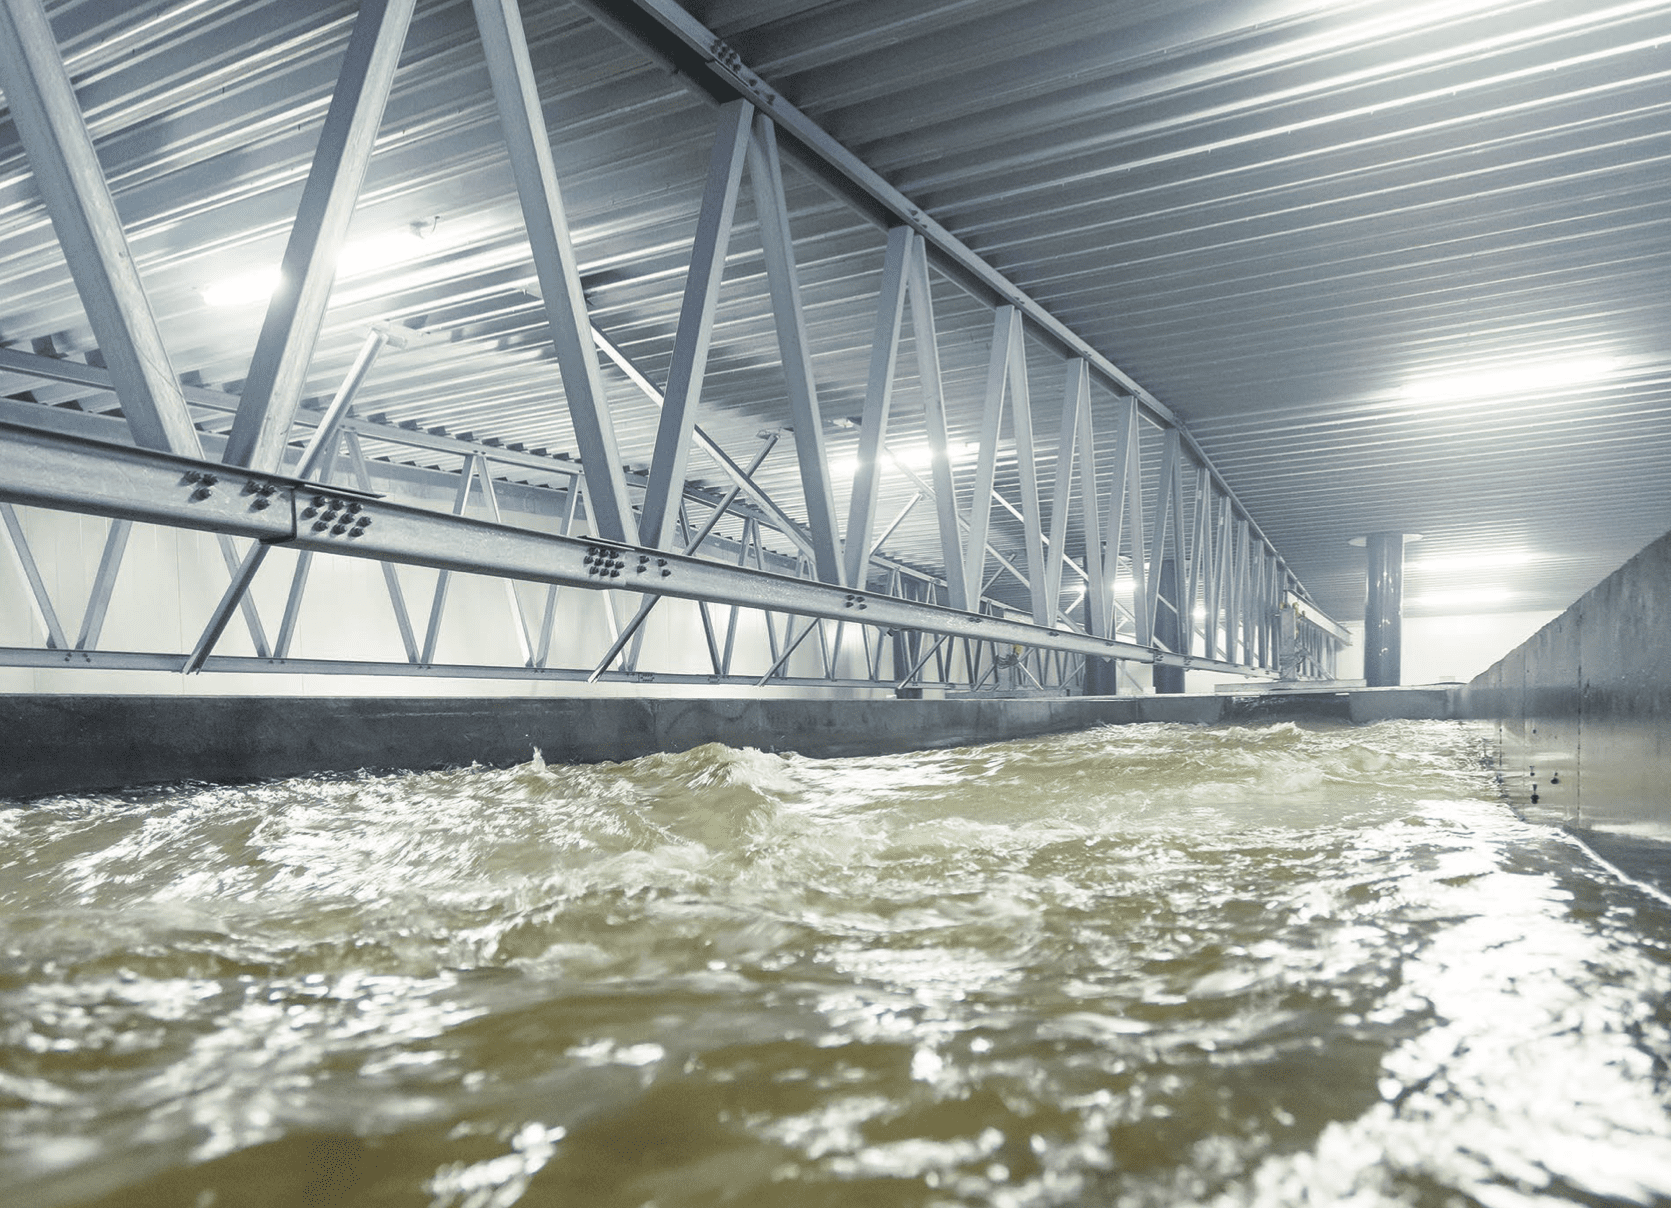
Anaerobic environments with H2S can be formed anywhere on a fish farm, particularly in biofilters with insufficient aeration and stagnant piping systems. The concentration of sulphate (SO42-) is significantly higher in seawater (2,700 mg/L) as compared to freshwater (5-50 mg/L) (Letelier-Gordo et al., 2020). However, a fish farm needs to operate below 5ppt in salinity before SO42-becomes limiting for H2S- formation.
Sulphate-reducing bacteria (SRB) compete with nitrate-reducing bacteria (NRB) for carbon in the form of volatile fatty acids. If a fish farm operates at a higher nitrate level, then NRBs can outcompete the SRBs for limiting volatile fatty acids. Some evidence even supports it being used as a remedy for H2S accumulation rather than a preventive measure in shrimp ponds (Torun et al., 2020). This solution however presents issues with nitrogen discharge which is less environmentally sustainable.

Different species of fish have different sensitivity to H2S in the water. The literature suggests fish are highly sensitive to H2S. Levels of 2μg/L in freshwater and 5μg/L in salt water can cause acute stress and even mortality with 2-4 weeks of chronic exposure according to newer unpublished research (Nofima, 2022). Some literature suggests concentrations above 25μg/L can be lethal for fish. Recent research proposes a critical H2S concentration 60.7 ± 13.2 μg/L at 14°C (Bergstedt & Skov, 2023). However, there is not final consensus on the exact lethal concentration.
Biofilters have been reported to be able to generate upwards of 139 g H2S per m3 biofilter volume, when mixing and aeration are insufficient. Consequently, it is of paramount importance to keep biofilter performance monitored (Rojas-Tirado et al., 2021).
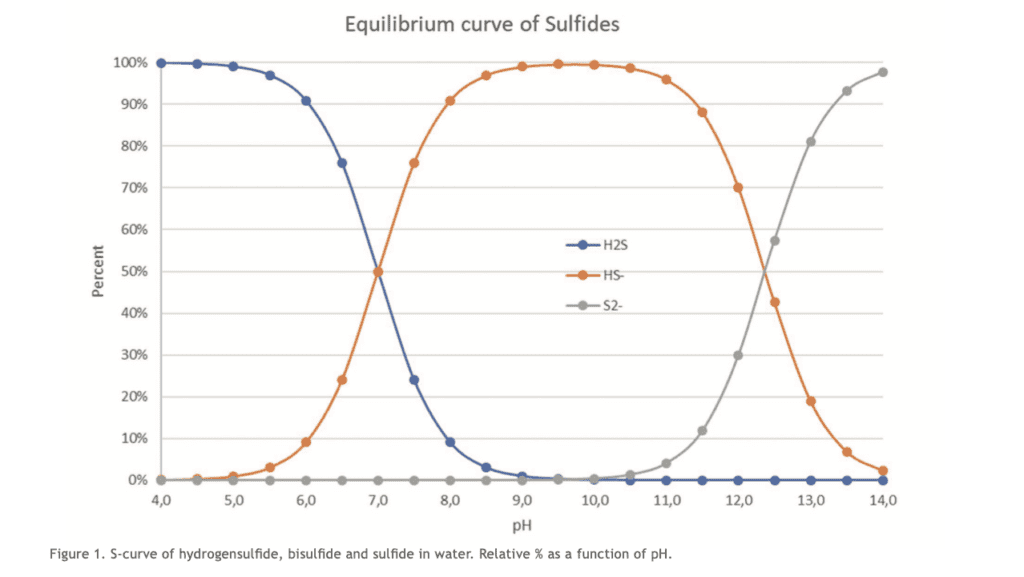
The relative concentration of H2S is most dangerous at lower pH values. Conversely, it becomes less dangerous at higher pH values, where it exists at HS-. H2S gas readily binds into the water and exists in equilibrium in its aqueous form of H2S as well as HS- and S2-. At pH 7.4, around 72% exists as HS- and 28% as aqueous H2S (Li & Lancaster, 2013).
Removing and monitoring hydrogen sulphide
Luckily, there is constant removal of H2S and HS- across fish farms. HS- binds with metals to form metal sulphides, H2S can be degassed, and chemically oxidized by ozone, peroxide, or oxygen and in biological oxidation processes with nitrate by microbes (Bergstedt et al., 2022). Chemical oxidation via oxygen or peroxide has been proven particularly effective in aquaculture since this is already commonly used for disinfection or oxygenation. This targeted approach often proves very potent due to targeting the larger HS- pool rather than the H2S pool which is significantly smaller at the operational pH level (Bergstedt et al., 2022; Bögner et al., 2021).
Fish farms ought to minimize the accumulation of H2S. There are systems today that can measure total HS- several times a day across many locations on a RAS, creating up to 72 data points daily. This technology effectively measures both the H2S and HS- in the water sample by lowering the sample pH. This creates a higher proportion of gaseous H2S which can be extracted by running the more acidic water sample across a dual membrane system. This allows for earlier detection of changes in concentration than other systems that purely measure H2S, since the detection limit effectively gets artificially lowered.
Monitoring H2S down to the microgram concentration is not on its own the most important defense against H2S sudden release. It is also a well-documented issue that feces and the residual biological matter will create a basis for H2S releases in recirculation systems (Rojas- Tirado et al., 2021). Consequently, understanding fecal matter removal and associated biofilter health is critical in defense against H2S in recirculation systems.
While modern fish feeds are generally optimized to produce robust feces, the hydrodynamics in fish tanks will often smash the feces into smaller particles, before they can be efficiently removed mechanically. Data indicates that some fish tank designs result in dissolved feces to form a “soup” that raises the risk of H2S release and must be entirely cleaned by expensive biological means.
By monitoring turbidity and particle sizes before and after fish tanks1, the manager can monitor directly how many fecal particles are being smashed before mechanical filtration. By monitoring turbidity and particle sizes on either side of a mechanical filter, the manager can see how many particles are escaping mechanical removal. Finer particles escaping mechanical removal typically end being trapped inside the biofilter. Again, by monitoring either side of the biofilter, the manager can monitor particle quantity and size being accumulated or released over time. This provides a rich picture of both biofilter health as well as overall farm health.
The most effective way to monitor these gradients and manage fish tank and filter performance is by using advanced centralized measurement technologies. This also brings the cost of acquisition down on a farm since it allows for single high-end sensors to monitor multiple places on a farm instead of having to invest in multiple lower-end sensors for the same cost. Installing multiple sensors is furthermore accompanied by high technician prices to properly install them. Companies providing a turnkey solution of data sampling often have a cloud solution associated so the client can watch their data online in real-time or near real-time from all over the world either on a computer, tablet or even phone. However, these technologies can be tooled with many additional parameters. For example, by monitoring total inorganic carbon, pH, oxygen and ammonia gradients the manager can better manage a healthy biofilter with fewer anaerobic zones that can generate H2S.
References available on request.
1) Turbidity measures the interaction of light on suspended particles of varying size, shape, color and reflectivity. Particle counting can quantify both particle size and number and is potentially an even more useful tool.