Monitoring Performance of a Water Treatment System
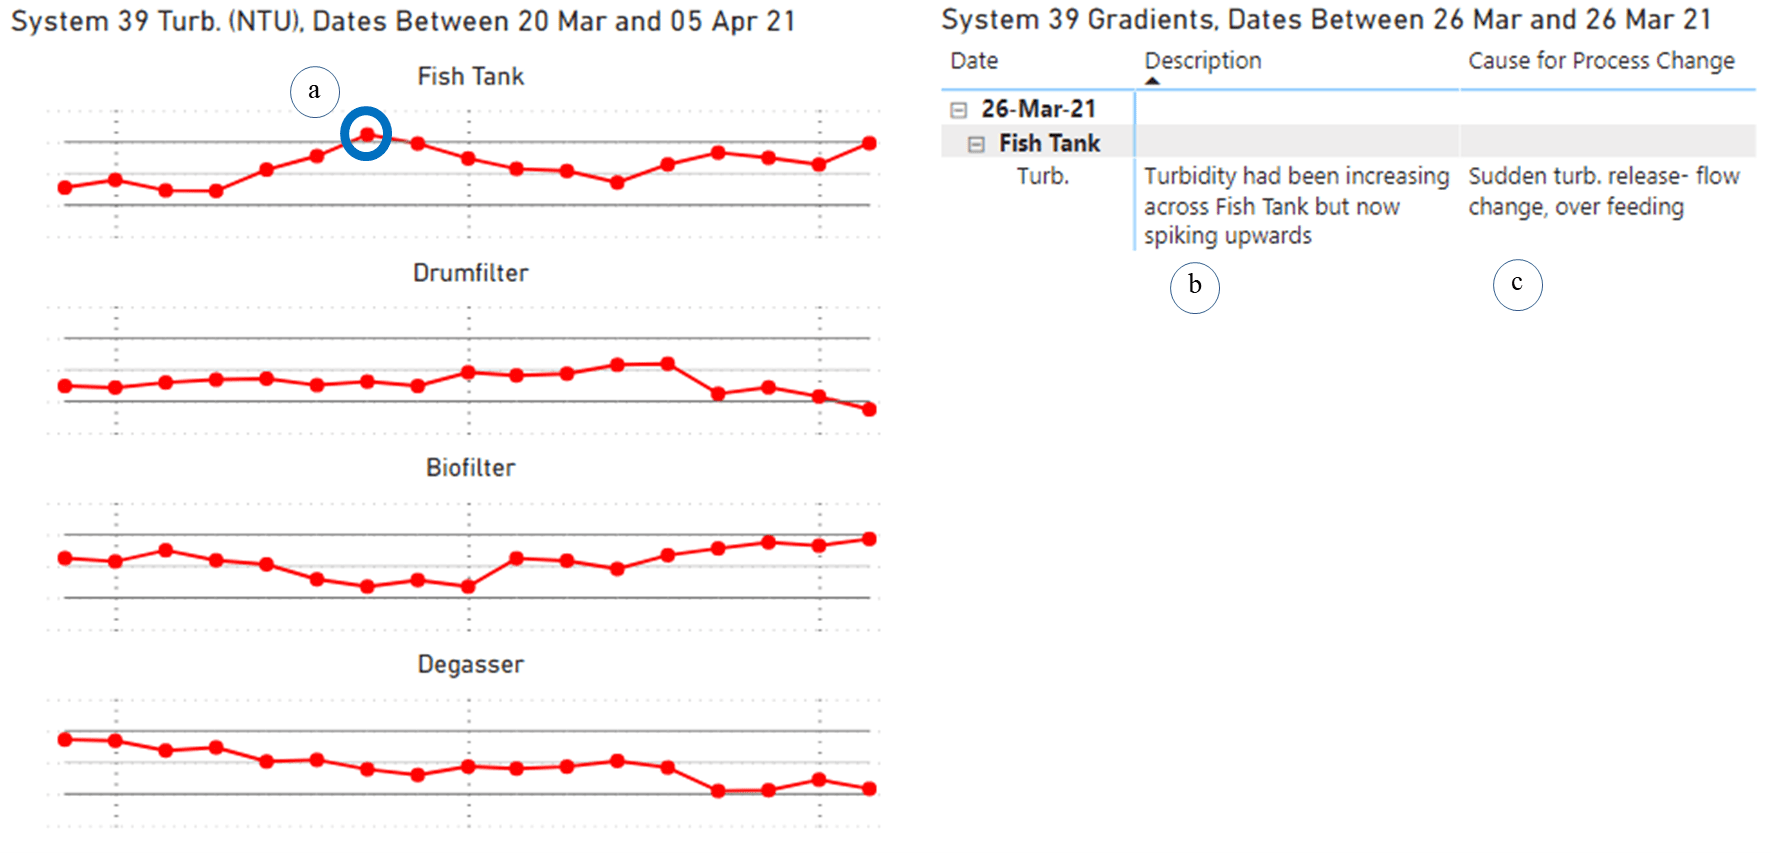
This document is one part of several documents describing how a disturbance in one device can negatively influence other devices on a RAS-farm. A diagram called a Perform-o-Gram, can simply show how turbidity is shifting around a RAS farm. The Perform-o-Gram redline for the fish tank crosses the upper outer limit at point (a) below, giving a performance alert.
Fill out the form to read more: